Breakthroughs in Data Viz, Government Accountability Trackers, Real-time Video Animations, and More at Hacks/Hackers NYC Demo Day 5

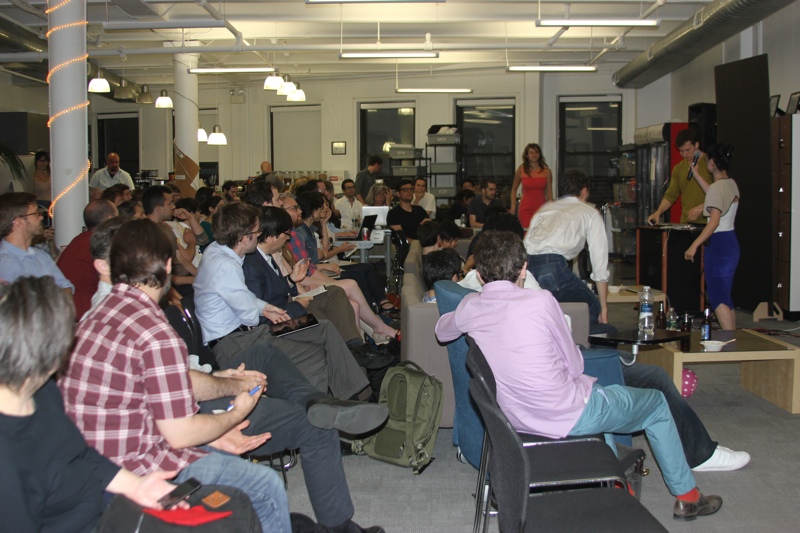
Hacks/Hackers NYC gathered for Demo Day 5 at Pivotal Labs for another inspiring mashup of startups hacking the future of content. The Summer 2013 demos by the Hacks/Hackers NYC community explored technology to better visualize information and tell compelling stories. They ranged from editorial visualizations and video interactives, to query searches, to building transparency in health costs. Each presentation was limited to 5 minutes followed by a 5 minute Q&A by the audience. Here is a brief rundown of each demo presenter. Video of the meetup is at the end of this post. Hacks/Hackers NYC community, feel free to clarify, ask questions or comment below.
Johnny Dwyer of R/GA kicked off the session with “Words & Votes,” an editorial visualization for Sandy Hook Promise. They rely on two sources, a Twitter API and GovTrack.us and answer the problem of how to crack data visualization whilst placing pressure on Congress. Neato. A quick key shows colors red and green as type of vote and squiggly lines illustrate (for example) gun legislation on an ideological spectrum. “Words & Votes” is based on ‘bricks and bubbles’ or facts and quotes, a neat, new way to visualize data.
**Chartbuilder: **
David Yanofsky of Quartz demoed Chartbuilder, solving the bottleneck problem in time it takes to make charts in digital newsrooms. Yanofsky refers to the challenge as “ugly charts on a beautiful site.” Well put, David. Chartbuilder allows the user to paste data directly from an excel spreadsheet and download an image of a chart – a major time saver. Success points? It’s allows for greater independence in the newsroom and more news coverage. Win-Win.
Data Docs, an interactive video platform uses animation and live scraped data to ensure videos stay evergreen. Utilizing HTML5 and popcorn.js, the idea behind Data Docs is that the data comes from continuously updated databases so as to never go obsolete. Lam Thuy Vo, Joe Posner and Susan McGregor met at the PBS/POV Hackathon (http://www.pbs.org/pov/hackathon/) where nonfiction storytelling and technology intersect. Check them out.
Porter Bayne of ProPublica demoed ReadrBoard, allowing readers to select specific reactions to content. Porter paints the analogy likeso, “Google captures the world’s questions, Facebook captures the world’s connections, and ReadrBoard captures the world’s reactions.” To top it off, ReadrBoard is interactive where users can scroll the site to view reactions of leaders including a variety of more nuanced choices the traditional “Like” button allows for. Some of these include ‘absurd, appalled, agree, so what?’ to name a few. Next steps are to create a content recommendation tool. Rest assured, Readrboard will always be free for publishers and will eventually run on a subscription model.
Kenton Powell**, **Bloomberg Digital Data by day, introduced QueryCongress, a query site allowing more streamlined visualization searches on Congress utilizing data scraping. Kenton demoed an illustration search of districts as example with “a Hispanic constituency” as chosen query. The search was magical. It instantly matched and pulled data drawing on all sorts of interesting data points including gender, demographics, and voting habits to name a few. Viewers may also choose a scatterplots if preferable to the palate. QueryCongress will be available on QueryCongress soon so keep a keen eye out on the lookout.
Ever wish you knew exactly how much it cost for a pricey teeth filling, birth control pills, or a mammogram? Jeanne Pinder, former New York Times editor and Tow-Knight Fellow, founded Clear Health Costs – a site utilizing traditional research and reporting to provide transparency in what she refers to as “what stuff costs in healthcare.” Juxtaposing benchmark prices with well-researched government data, Clear Health Costs lists price ranges in health items and procedures across a wide spectrum. They have over 8,500 datapoints in their database and over 34% of their use is mobile. She has recently been featured on WNYC’s Brian Leherer Show, and the future looks on the up and up.
Chris Dannen of FastCompany demoed Writebot, a real-time collaborative application built to optimize production, communication and data accessibility for enterprises. Chris describes Writebot as smart ‘responsive web design’ that utilizes social scraping and a collaborative text bucket to have everything you need in one place. And yes, this includes privacy, ‘CUGS’ or closed user groups, activity feeds, hacked firepads and more. Good stuff.


