Data Journalism: A Showcase of Viz Projects in India
Suggest editsBuilding on the excitement around data journalism at our previous hackathon, Hacks/Hackers New Delhi recently paired up with the Hindustan Times — one of India’s leading English newspapers — to host a showcase of innovative data journalism work going on in the country.
The goal was to share best practices when it comes to using data to source, tell and visualize stories.
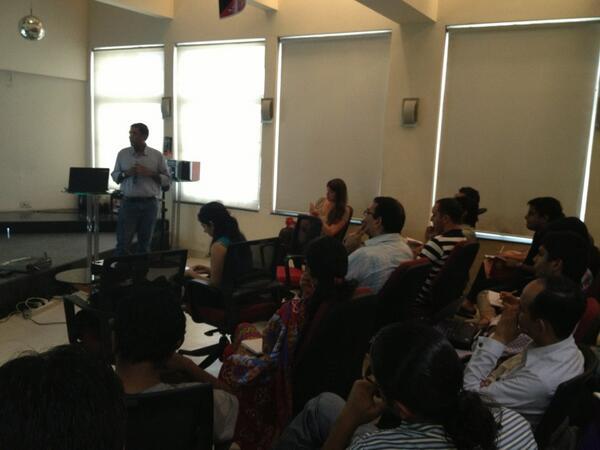
Avinash Celestine of the Economic Times started off by explaining how he’s using open data – particularly Indian government census data – to answer big questions about socioeconomic trends on his Datastories blog. He stressed the importance of putting data in context, giving the example of how he recently tried to understand women’s declining participation in the labor force by contrasting it with data about increased studying and housework.
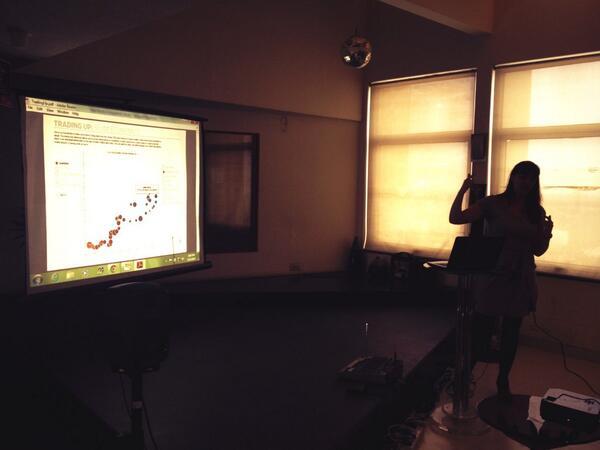
Cordelia Jenkins of Mint newspaper explained Trading Up: Slum Economics, the data journalism project that recently won the GEN Editor’s Lab hackathon in New Delhi. The team’s goal is to create an app that visualizes and displays detailed household and economic data for slums. Users can compare different slums side-by-side, graph the parameters they choose, and ideally – for journalists – pick out story ideas. The project is at the concept stage, and will take another three months to become operational.
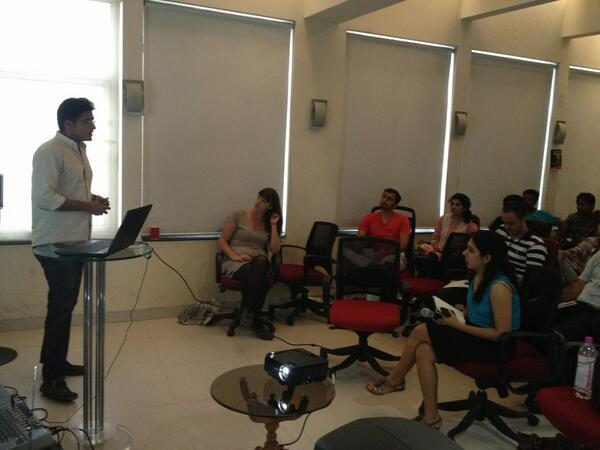
Ravi Bajpai of Down to Earth talked about how he produces data visualizations in a hurry – in a day or less – for the organization’s blog. He parses survey results, pulls out relevant data, and creates interactive infographic-driven posts that draw a lot of users, get good traction on social media, and keep users on page for longer.
Neeta Verma, who works with the government’s National Informatics Centre, presented data.gov.in, a new open data site from the Indian government. The site features several tools, including inbuilt visualizations that users can embed on outside blogs and pages, the opportunity to request and vote for more data sets, and a developers community. The site is free, but has lagged in adoption as NIC works to get more data onsite.
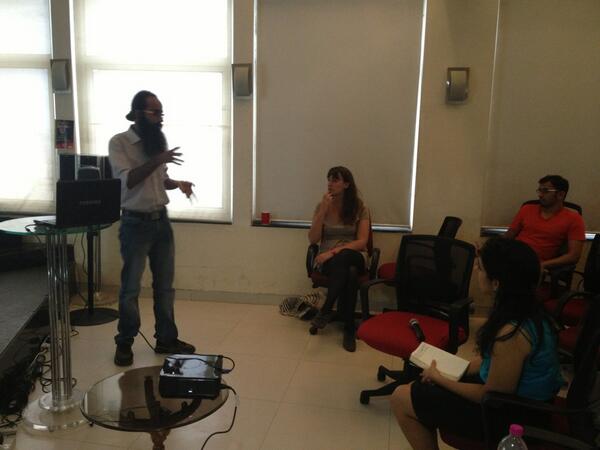
Guneet Narula, of the data science collective DataMeet, presented some of the work that their members have done. Their projects include the Geohackers blog and the India Water Portal. Most of their members, he said, come from a coding and tech background, and would like to work more with journalists.
Between them, the presenters mentioned several freely available tools for quickly packaging/presenting data, including the D3 viz library, Tableau Public, Datawrapper, Leaflet, and MapBox.
Overall, an informative set of presentations that explored some of the creative data-driven work going on in India today. About 50 people came to Sunday’s event at the HT House, and several more followed along on Twitter. For more info about Hacks/Hackers New Delhi or to join, check out the meetup page.